Posts
Showing posts from September, 2022
DA-100 PL-300 Topics
- Get link
- X
- Other Apps

You have a table that contains sales data and approximately 1,000 rows. You need to identify outliers in the table. Which type of visualization should you use? A. donut chart B. pie chart C. area chart D. scatter plot Correct Answer: D Outliers are those data points that lie outside the overall pattern of distribution & the easiest way to detect outliers is though graphs. Box plots, Scatter plots can help detect them easily. Reference: https://towardsdatascience.com/this-article-is-about-identifying-outliers-through-funnel-plots-using-the-microsoft-power-bi-d7ad16ac9ccc You need to create a visual as shown in the following exhibit. The indicator color for Total Sales will be based on % Growth to Last Year. The solution must use the existing calculations only. How should you configure the visual? To answer, select the appropriate In the Background color or Font color dialog box, select Field value from the Format by drop-do...
Database Architect Interview questions
- Get link
- X
- Other Apps

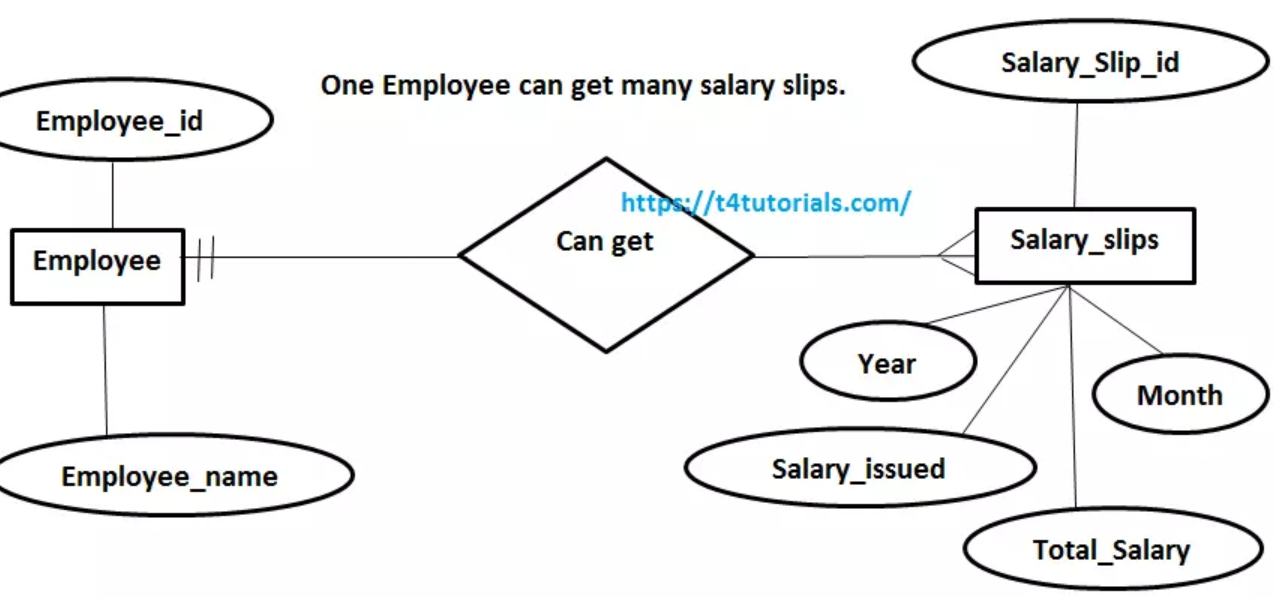
1-> How to create one to one relationship. Answer-> https://www.tutorialspoint.com/One-to-One-Relationship-in-DBMS#:~:text=One%2Dto%2DOne%20relationship%20in%20DBMS%20is%20a%20relationship%20between,of%20an%20entity%20with%20another.&text=An%20Employee%20is%20issued%20an,Card%20(ID_Card)%20are%20entities. One-to-One relationship in DBMS is a relationship between an instance of an entity with another. An Employee is issued an Employee ID Card. An individual employee is offered a unique ID card in the company. Here, Employee and I D Card (ID_Card) are entities. A One-to-Many Unary Relationship is the association with the same entity between the same instances represented by different role groups. Consider the relationship between Managers and Employees.The two different Roles in this relationship are- Managers and Employees. Only few Employees take the role of Managers within an organization while everyone working for an organizat...
PL-300 questions and answers
- Get link
- X
- Other Apps

Question #29 Topic 1 HOTSPOT - You have a folder of monthly transaction extracts. You plan to create a report to analyze the transaction data. You receive the following email message: `Hi, I've put 24 files of monthly transaction data onto the shared drive. File Transactions201801.csv through Transaction201812.csv have four columns while files Transactions201901.csv through Transaction201912.csv have the same four columns plus an additional three columns. Each file contains 10 to 50 transactions.` You get data from the folder and select Combine & Load. The Combine Files dialog box is shown in the exhibit. (Click the Exhibit tab.) x https://www.examtopics.com/exams/microsoft/da-100/custom-view/ 26/169 The columns used are based on the entire dataset. The additional columns in the 2019 files will be detected. Box 3: Yes - Note: Under the hoods, Power BI will automatically detect which delimiter to use, and may even promote the first row as headers. You can manu...